
The Geometry
of Digital Markets.
At Airlyn Digital, we bridge the gap between raw market data and actionable insight. Our educational modules are built upon rigorous charting concepts and specialized TradingView methodologies designed for the Australian digital asset landscape.
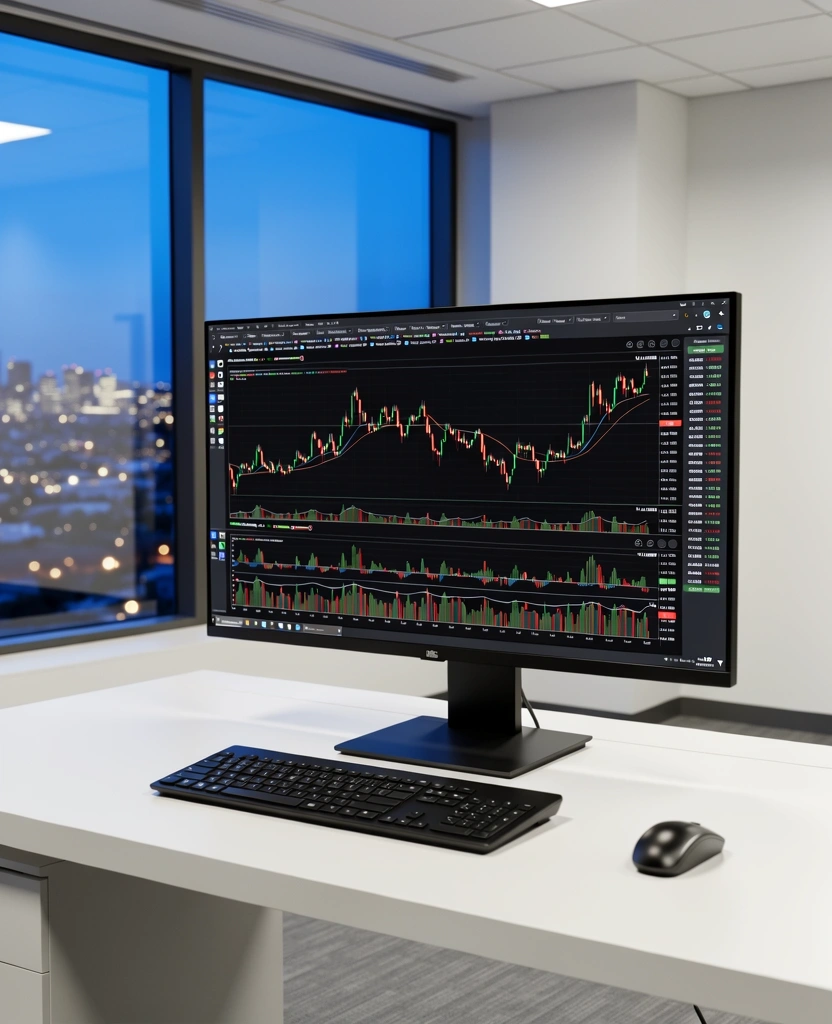
Visual Precision with TradingView.
Precision in digital asset evaluation requires more than just standard indicators. We utilise the TradingView engine to teach high-probability setups across multiple timeframes. By customising scripts and layout templates, we enable our students to filter market noise and identify institutional footprint patterns.
-
Custom Scripting Logic
Proprietary Pine Script applications for volume-weighted sentiment analysis.
-
Multi-Timeframe Syncing
Institutional-grade layouts that align macro trends with micro entry points.

"The tool is only as effective as the framework guiding it. We teach the framework first."
Protocol Alpha
The Toolkit
Components of our Analysis Curriculum.
Harmonic Variance
We move beyond simple support and resistance. Our modules explore market cycles through the lens of harmonic price action and Fibonacci extensions.
Volatility Compression
Identifying the calm before the storm. Learn to interpret Bollinger Band Squeezes and Keltner Channel crossovers for breakout timing.
Order Flow Visuals
Analysing the tape in a digital format. We teach students how to read aggregate order books and liquidation heatmaps across major global exchanges.
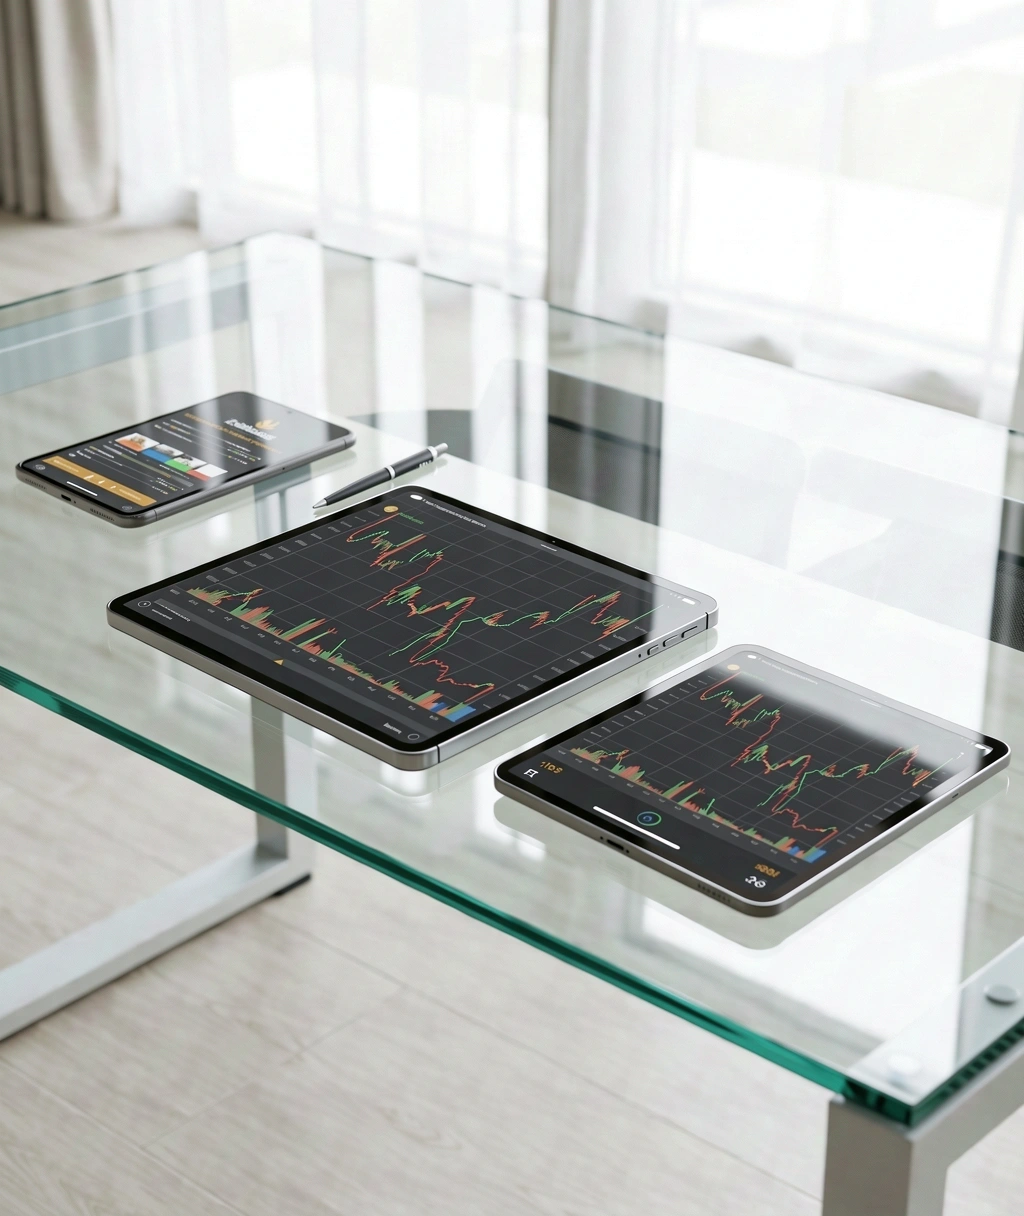
Charting Efficiency
for the Modern Professional.
Digital asset markets never close. Therefore, your analysis tools must be robust and accessible. Airlyn Digital provides configured TradingView templates that standardise visual outputs across our entire student community, ensuring everyone speaks the same technical language.
Custom Workspace Layouts
Optimised for dual-monitor setups or single laptop focused viewing.
Real-time Alert Structures
Dynamic alerts based on mathematical trend exhaustion, not just price price points.
Our tools do not predict the future. They manage the mathematics of risk.
"Technical analysis is often misunderstood as a crystal ball. At Airlyn, we treat it as a risk-reward calculator. Our charting modules are designed to show you where you are wrong before you commit capital."

Master the Charts.
Own the Outcome.
Join our intensive Canberra-led education modules to gain access to the full Airlyn Digital indicator suite and TradingView workspace templates. Ready to shift from observation to execution?